
The Dunning-Kruger Effect Graph Explained: Why the “Mount Stupid” Curve is a Myth
The viral confidence curve isn’t what Dunning and Kruger published. See their real chart, where ‘Mount Stupid’ came from, and why it matters
 Berry Bits
·
October 28, 2026
·
8 min read
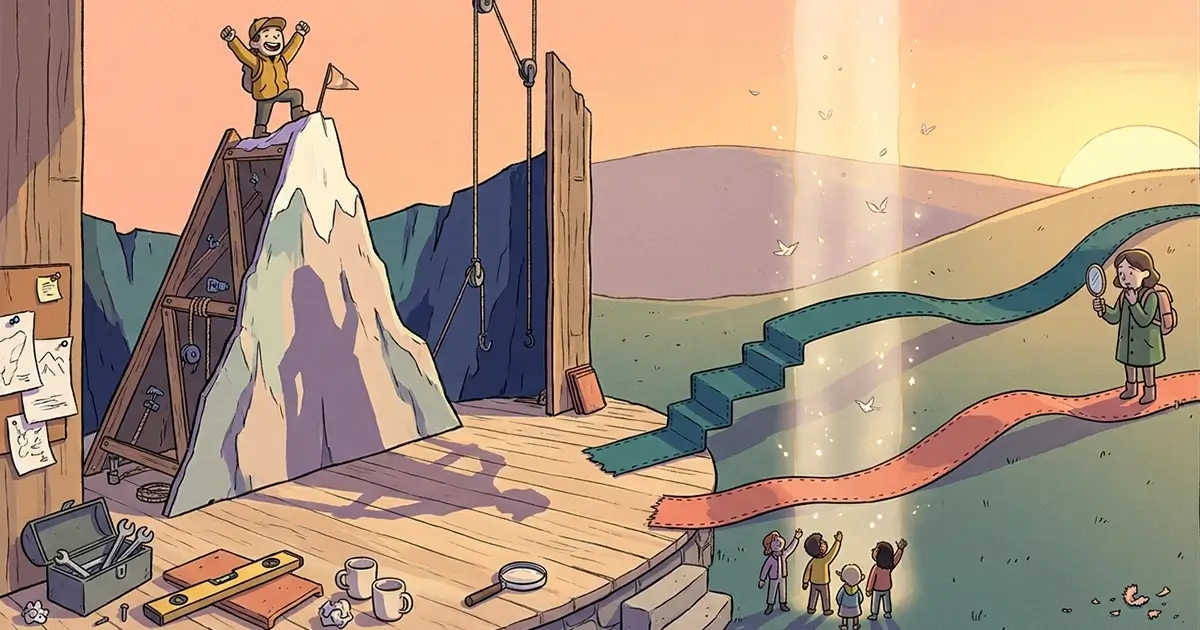
You’ve probably scrolled past it on social media: a line that rockets upward, slams into a peak labeled “Mount Stupid,” plunges into the “Valley of Despair,” then crawls toward “Enlightenment.” It’s neat, funny, and instantly relatable.
It’s also not what Dunning and Kruger published.
The dunning-kruger effect graph that went viral is a remix, built by the internet and passed along until it felt like science. In this article, we’ll look at the real chart, trace where the meme came from, walk through four realistic examples, and show you how to use the idea without misusing it.
What the Viral Dunning-Kruger Curve Claims
The meme version has a clear story. Confidence is on the vertical axis and knowledge or experience is on the horizontal axis. When you know almost nothing, you’re suddenly very confident. Learn a bit more, and your confidence collapses. Keep going, and it slowly rebuilds, this time earned.
The labels vary from post to post. You’ll see “Peak of Mount Stupid,” “Valley of Despair,” “Slope of Enlightenment,” and “Plateau of Sustainability.”
The shape is satisfying, which is exactly why it spreads. It turns a messy psychological finding into a three-act story anyone can recognize from their own life. The trouble is that a good story and an accurate chart are two different things.
What Dunning and Kruger Actually Published
In 1999, psychologists David Dunning and Justin Kruger published a paper titled “Unskilled and Unaware of It” in the Journal of Personality and Social Psychology. They tested Cornell University students on humor, logical reasoning, and English grammar. Afterward, they asked participants to estimate how well they had done compared with their peers.
Here’s the real chart in plain words. The researchers sorted people into four groups based on their actual scores, from the bottom quartile to the top. Then they plotted two lines: how people actually performed, and how they thought they performed.
The “actual” line climbs steeply from bottom to top, because that’s how the groups were sorted. The “perceived” line barely rises at all. It’s a gentle slope, and everyone guessed somewhere above average.
The bottom group scored around the 12th percentile in the humor test, yet they believed they were closer to the 60th. The top group slightly underestimated themselves. Nobody in the data peaks and then crashes.
That’s the real finding: people with the least skill tend to overestimate themselves the most, partly because the skills needed to do something well are often the same skills needed to judge whether you did it well.
There is no mountain, no valley, and no dramatic fall. The original chart shows a gap between perception and reality, and the gap is widest at the bottom.
Where “Mount Stupid” Came From
Nobody can point to one inventor, and anyone who claims to is guessing. The phrase seems to have spread through forums, blogs, and later memes during the 2000s and 2010s, and it stuck because it’s catchy.
The shape of the curve probably borrows from another famous diagram. The business world’s hype cycle has a “peak of inflated expectations,” a “trough of disillusionment,” a “slope of enlightenment,” and a “plateau of productivity.” Compare those labels with the meme’s, and the family resemblance is hard to miss.
In other words, the dunning-kruger effect meme is likely a mashup: a real psychology finding wearing the clothes of a technology adoption chart.
Nothing in the 1999 data measures confidence over time as someone learns a subject. The study compared different people at one moment in time, not one person’s journey from beginner to expert. That distinction matters, and it’s the quiet reason the curve can’t be derived from the paper.
Four Realistic Examples
Let’s make this concrete. Each example shows either the real effect or the way the myth gets misused.
Example 1: The Logic Quiz

Marcus, a 27-year-old marketing coordinator in Austin, takes an online reasoning quiz for fun. He rushes through it, feels great, and predicts he beat about 70 percent of test-takers. His actual result lands near the bottom quarter.
This is the real Dunning-Kruger pattern. Marcus didn’t know which logical mistakes to look for, so he couldn’t spot them in his own answers. His confidence wasn’t foolish. It was blind to what he was missing.
Notice what’s absent: no peak, no crash. He simply guessed high.
Example 2: The Bathroom Tiles

Jun Wei and his wife, Mei Ling, in Singapore decide to retile their bathroom after watching two videos. Jun Wei feels ready. The job takes three weekends, and the tiles end up uneven.
Is this “Mount Stupid”? Sort of, but only in the meme sense. A learner who has just discovered how much there is to know can feel cocky, then humbled by reality. That emotional arc is real and common. But it comes from experience and feedback, not from the 1999 study.
Mei Ling’s reaction is the telling part. She ran a quick measurement with a level and said the corners looked off. Outside feedback closed the gap between his perception and reality faster than any private reflection would have.
Example 3: The Expert Who Doubts Herself

Rachel is a senior software engineer in Seattle. She can design a complex database in an afternoon, yet in meetings she hedges everything, assuming her colleagues know what she knows.
This is the other half of the actual graph, and the half the meme tends to ignore. In the study, top performers tended to underestimate how they ranked, partly because tasks that feel easy to you seem easy to everyone.
Rachel isn’t suffering from “Valley of Despair.” She’s making a reasonable but wrong assumption about other people’s skills.
Example 4: The Meme as a Weapon

Kai Xiang and his wife, Sarah, are arguing over whether to refinance their mortgage. Sarah has read a lot about interest rates. Kai Xiang rolls his eyes and says, “You’re on Mount Stupid right now.”
Here the myth does real damage. The graph can’t tell Kai Xiang whether Sarah’s numbers are right, and it can’t prove she’s overconfident. Using it that way is a shortcut that replaces the argument with a label.
It also backfires, because he’s now assuming he knows where she sits on a chart, which is its own kind of overconfidence. A better move would be to open a spreadsheet and test her assumptions together.
Why the Mount Stupid Myth Matters
You might wonder whether any of this matters. It’s a meme. Who’s hurt?
First, it teaches a false lesson. If people believe that confidence always crashes with learning, they’ll assume any confident beginner is a fool and any doubtful learner is on the right track. Reality is messier. Some beginners are well calibrated, and some experts are wildly overconfident.
Second, it makes the idea unfalsifiable. Once a graph can place anyone anywhere, it becomes a way to dismiss opponents rather than examine your own thinking.
Third, the real research itself has been debated. Several later analyses argue that some of the original pattern can be explained by statistical effects, such as regression to the mean and the general tendency for people to rate themselves above average. Dunning and others have defended the core finding, and researchers still discuss how much of the effect is psychological and how much is a measurement artifact. The honest summary is that the effect is real in many settings, but its size and cause are still debated.
That’s a more interesting story than a mountain, and it’s also a more trustworthy one.
How to Use the Idea Honestly
You don’t have to abandon the concept. You just have to apply it with care. A few habits help:
Ask for feedback early. Outside eyes close the gap between how you feel and how you perform.
Test yourself. Quizzes, practice problems, and real-world trials beat gut feelings.
Watch for “this is easy” moments. When something feels easy right after you’ve started, that’s the time to double-check.
Aim it inward first. The Dunning-Kruger effect is a tool for examining your own blind spots, not for diagnosing other people.
Stay curious about experts. If you’re skilled, remember that others may not know what you know.
Frequently Asked Questions
Is the Dunning-Kruger effect graph real?
The meme curve with “Mount Stupid” is not from the original paper. The real chart compares perceived and actual performance across four skill groups, and it shows a gap, not a peak and a valley.
Did Dunning and Kruger ever draw the Mount Stupid curve?
No. The 1999 paper doesn’t include a confidence-versus-experience curve with a peak and a crash. The meme was created later by internet users.
Is the Dunning-Kruger effect itself a myth?
Not exactly. The tendency for low performers to overestimate their ability has been observed in many studies. However, researchers debate how much of it is psychology and how much is statistics, so treat it as a real but nuanced finding.
What does the Dunning-Kruger curve actually show?
It shows that people in the lowest-scoring group rated themselves much higher than their results justified, while top scorers rated themselves slightly lower than their results justified.
How can I avoid overconfidence when learning something new?
Seek feedback, measure your results with real tests, and give yourself time. Confidence that has been checked against reality is far more reliable than confidence that hasn’t.
Final Thoughts
The dunning-kruger effect graph that fills your feed is a fun story, but it isn’t a scientific result. The real chart is quieter: a gap between how people see themselves and how they actually perform, widest at the bottom and reversed at the top.
The takeaway isn’t “other people are on Mount Stupid.” It’s that all of us have blind spots, and the best defense is humility, feedback, and a willingness to be checked. Use the idea as a mirror, not a weapon.
Have you ever caught yourself being overconfident, or spotted a graph that wasn’t what it seemed? Share your thoughts in the comments below!


Comments (0)
No comments yet. Be the first to share your thoughts!
Leave a comment
Your comment will appear after it's reviewed. Your email is never shown publicly.